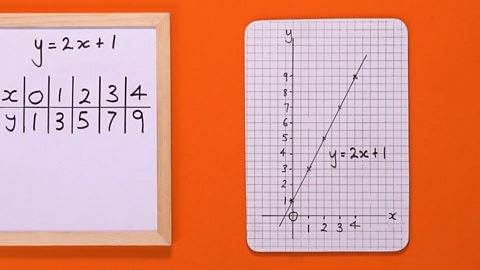
A linear equation is drawn as a straight line on a set of axes.
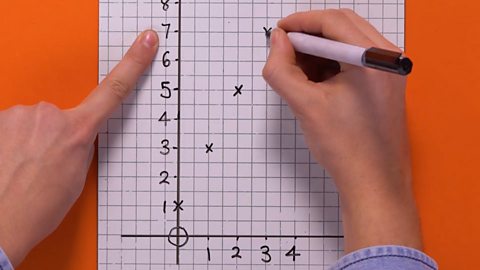
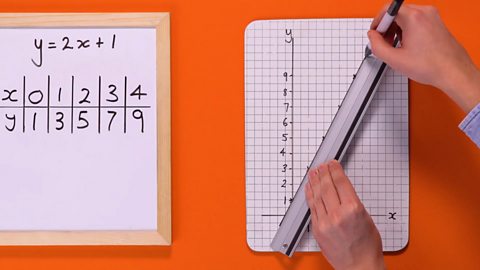
To draw the graph we need coordinates.
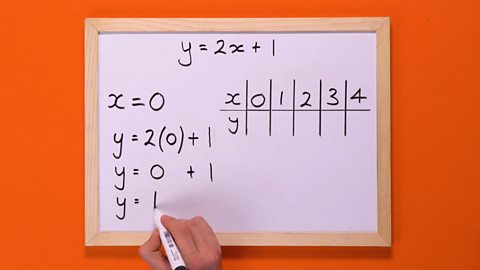
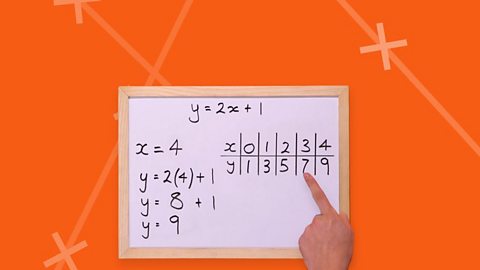
We generate these coordinates by substituting values into the linear equation.
Find out how to draw a graph of a linear equation
Have a go
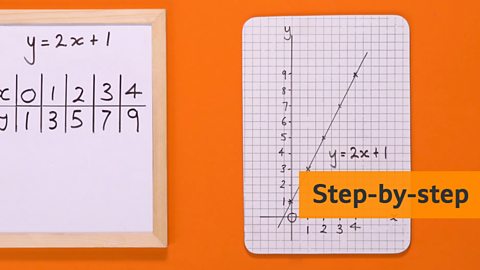
Image caption, Click to see a step-by-step slideshow.


1 of 8
How to draw a graph of a linear equation
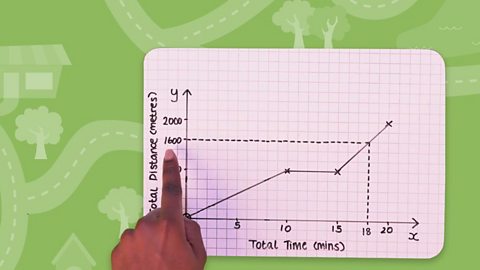
A linear equation is represented as a line graph. In order to draw the line graph we require several pairs of coordinates. These coordinates represent the relationship given in the equation.
For example, for y = 3x, the y value is always equal to '3 lots' of the x value. (1,3), (10,30) and (2.5,7.5) are all coordinates on the line y = 3x.
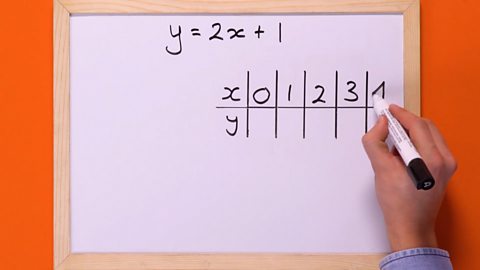
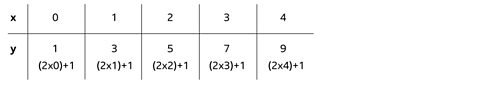
Often a table of values is used to create the coordinates. We use substitution to calculate the values.
For example y = 2x + 1
The y value is always '2 lots' of the x value plus 1.
We replace the value of x for different numbers and record the resulting y value.
More on Straight line graphs
Find out more by working through a topic
- count3 of 8
- count4 of 8
- count5 of 8

- count6 of 8