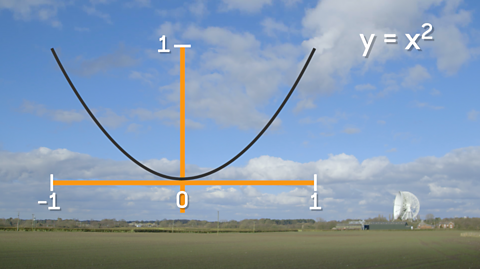
- A parabola is a symmetrical, curved, U-shaped graph.
- The equation of a parabola graph is y = xВІ
- Parabolas exist in everyday situations, such as the path of an object in the air, headlight shapes and the wire of suspension bridges.
The education officer at Jodrell Bank describes how parabolas explain the structure and shape of the Lovell telescope
Parabolas in graphs
The equation of a parabolic graph is y = xВІ and all quadratic graphs have a line of symmetry which passes vertically through the minimum or maximum point.
The minimum point is the minimum y value that the parabola reaches.
The maximum point is the maximum y value that the parabola reaches.
The symmetry of the parabola is created because each x value is squared. Whatever value we square, it will always result in a positive value, regardless of whether it is positive or negative to begin with.
For example
-1.2ВІ = 1.44
2.5ВІ = 6.25
Graphs of y = xВІ + n can be easily drawn by moving the parabola n places up or down the y axis.
y = xВІ + 6 - moves the parabola 6 places up the y axis
y = x² – 7 - moves the parabola 7 places down the y axis
Examples of parabolas
In the video, the 2D curve of the Lovell Telescope dish is a parabola. It is this shape and structure that allows the telescope to gather incoming radio waves.
When the telescope is pointed towards a radio source in the sky, waves arriving from the source are intercepted by the bowl and reflected from its steel surface into the focus box mounted on top of the central tower.
More on Straight line graphs
Find out more by working through a topic
- count8 of 8

- count1 of 8

- count3 of 8