We've updated our Privacy and Cookies Policy
We've made some important changes to our Privacy and Cookies Policy and we want you to know what this means for you and your data.
Antarctica: What does the ocean floor look like?
Image source, Getty Images
Scientists have managed to make the most accurate map yet of Antarctica's Southern Ocean, showing the mountains, canyons and plains that make up it up.
Then map in total covers 48 million square kilometres, and for the first time ever shows a new known deepest point of the ocean floor. It's a whopping 7,432m down and is called the Factorian Deep.
Knowledge of the shape of the ocean's bottom is really important because it helps ships to safely navigate, as well as with marine conservation.
It could also be central to understanding Earth's climate and geological history, although scientists say we still have much to learn as lots of areas have never been properly surveyed yet.
How has this special map been put together?
Image source, IBCSO/AWI/NIPPON FOUNDATION/SEABED2030
It's called the International Bathymetric Chart of the Southern Ocean (IBCSO) and has taken five years to put together.
A previous version of the map was published in 2013, but this one has added much more significant updates.
This project and others like it around the world are gradually filling in the gaps in our knowledge about what lies the bottom of the world's oceans.
Ships and boats that travel in the area have also been encouraged to turn on their sonar devices so that more data can be gathered and used.
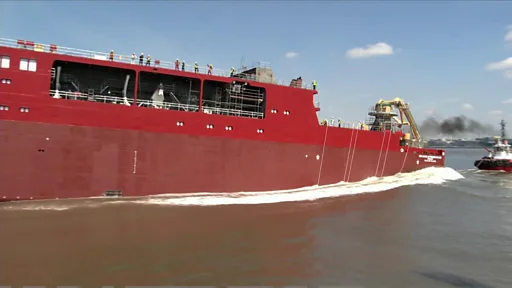
Much of the information has come from ships that support scientific endeavours in Antarctica, including from the UK's former polar ship, the RRS James Clark Ross.
The new ship the RRS Sir David Attenborough, will also do the same.
As these vessels have the ability to break through ice and shuttle back and forth between Antarctica and countries likes Chile, South Africa and Tasmania, using echo-sounders to survey the land far below the surface of the ice or ocean.
Research organisations from different nations have been working together more and more to try to try and cover slightly different routes than other ships so they can gather more information.
Governments, companies and institutions like universities are also being urged not to hide away research but to instead put make it public knowledge.
This has really been paying off!
To help with the mapping he 48 million sq km have been divided into 500m grid squares.
The original map began only at 60 degrees South, and there were measurements for less than 17% of its grid boxes.
The new map covers almost double the area and scientists now have at least one modern depth measurement for almost a quarter of the squares.
if you can't see this, click here
Why is research like this so important?
Better seafloor maps are needed for a host of reasons.
They are essential for safe navigation but also for managing how many fish are caught and conservation.
Marine wildlife tends to congregate around the underwater mountains so each segment of the map seamount is a biodiversity hotspot.
Image source, Getty Images
The seafloor also influences the behaviour of ocean currents and the vertical mixing of water.
Because oceans play a vital role in moving heat around the planet, this is information can be very important when it comes to forward planning especially when it comes to weather patterns and forecasting future climate change.
Dr Rob Larter from the British Antarctic Survey said: "We can also study how the Antarctic Ice Sheet has changed over thousands of years just by looking at the seafloor.
"There's a record of where the ice flowed and where its grounded zones (places in contact with the seafloor) extended. This is beautifully preserved in the shape of the seafloor."
There are remote and areas of the Southern Ocean that would be very difficult for human's to reach which means many sections of it are unlikely to get mapped but there is hope that robotic vessels may be able to carry this out at some point in the future.