From science to social media, statistics influence everything.
As British mathematician Lord Kelvin once said: "When you can measure what you are speaking aboutтІ you know something about it."
A similar sentiment was expressed by Winston Churchill who, during World War II, observed that тThe utmost confusion is caused when people argue on different statistical data.т
He wanted reliable statistics to help make the best decisions, and called for information that could be тaccepted and used without questionт. And so, the Central Statistical Office, one of the predecessors of todayтs Office for National Statistics (ONS), was born.
Like most other sciences, the use of statistics to make sense of our world has developed over time. And to mark National Numeracy Day (22 May) Professor Sir Ian Diamond, UK National Statistician, explains how.
1. The first census
In the late 18th Century, some people argued that the population would grow out of control, faster than the food supply needed to feed everyone, while others suggested that it was falling, leaving the country vulnerable to the ongoing conflicts with France.

The answer was a census. Held every 10 years, the census has given us a wealth of information beyond a raw population count ever since. The last one took place in 2021 and was the first to be digital by default. It could also be the last ever census. The ONS is looking at new ways to gather the same information on a more regular basis, using data sources such as the information we provide when we access public services like the tax, benefits, health and education systems.
Did you know? The 1821 Census showed that almost half the population was under 20 years old, compared with around a quarter today. By 1841, the census revealed that the most popular occupation was тdomestic servantт. There were also other occupations that you wouldnтt expect to see today, such as 74 тleech bleedersт and five тice-dealersт.
 Image source, Shutterstock
2. When early pioneers led the way
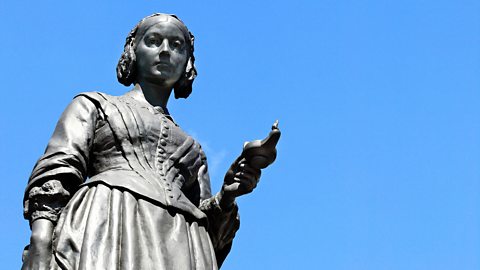
Florence Nightingale is remembered for her contribution to nursing, but her mathematical genius was what really saved so many lives.
While working with wounded soldiers, she collected statistics and realised that more of these soldiers were killed by diseases caused by unsanitary healthcare practices than from their injuries.
Similarly, mathematician Charles Babbage is known for being a computing pioneer, but heтs also generally credited with inventing the pre-printed survey form for the collection of statistical data.
These days, in addition to the traditional method of asking people for information through surveys, we also use existing data collected by other organisations and government departments.
Did you know? Babbage was plagued with a vendetta from Londonтs street musicians who would busk outside his house after he tried to get them banned.
3. When data helped us understand cholera
In 1854, Dr John Snow famously used meticulous record-keeping to establish that cholera was not transmitted by foul air.
He had witnessed hundreds of people around the area of his surgery in London dying of cholera within 10 days.
Snow plotted each death on a map and proved that those who had died all lived close to a specific water pump. As a result, the pump was disabled and there were no new cases of cholera deaths in the area.
Did you know? These days cholera is very rare in the UK and ONS records going back to 2013 donтt record any deaths from it.
 Image source, Shutterstock
4. The 'birth' of inflation
In 1914 the country went unexpectedly to war and there were fears that prices of essential foods would rise beyond the reach of ordinary people.
We then started measuring what we now call inflation: the rate at which prices are rising.
At first this only looked at the cost of basic items, but in 1947 the Retail Price Index was set up to capture price movements across the broad range of consumer spending.
Nowadays inflation figures affect a lot of things in our lives, from price changes to phone contracts to how much state pensions go up by.
Did you know? Every year, the ONS revises the goods it price tracks, which not only helps measure inflation but gives an insight into peopleтs changing habits. For example, 2022 saw canned pulses and meat-free sausages enter for the first time, in response to the growth in veganism.
 Image source, Shutterstock
5. The 1970 election - World Cup defeat or untimely data?
In 1970, the polls predicted that Labourтs Harold Wilson would win the General Election, but the Conservatives pulled off a surprise win.
Theories for the change in public mood included unhappiness caused by West Germany putting England out of the World Cup, and displeasure at some gloomy trade statistics released by the ONSтs predecessors. Recent analysis suggests that the bad economic news was much more likely to have influenced voters.
Today, the government imposes the тperiod of sensitivityт, during which communications activity is limited between the time an election is announced and the date itтs held. While this wouldnтt prevent the ONS from releasing positive or negative economic figures, it does put restrictions on any extra publicity of them.
Did you know? Today, the FIFA World Cup is the most popular sporting event at global level, with general awareness of the tournament scoring an impressive 91%.
The ТщЖЙЙйЭјЪзвГШыПк micro:bit playground survey was created to help children aged 7 - 11 get to grips with data science and digital skills in a fun and practical way. Find out more about the seven activities and get free resources on the playground survey site.

More from the ТщЖЙЙйЭјЪзвГШыПк micro:bit playground survey
ТщЖЙЙйЭјЪзвГШыПк micro:bit playground survey
Discover seven cross-curricular activities to find out more about your playground.

"I love that Iтve been able to use data to have an impact in lots of different areas"
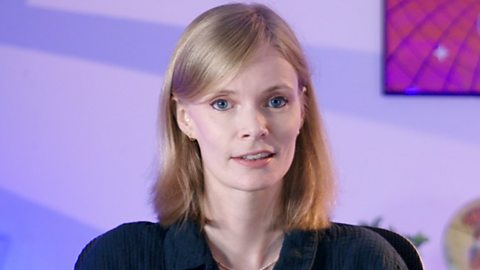
Professor Jennifer Visser-Rogers talks about her career in statistics and the importance of encouraging children to learn more about data.

тThe best way to learn most things is to just do it"
Video Creator and Gamer FalseSymmetry talks about her love of gaming and how to turn your passion into a career.
