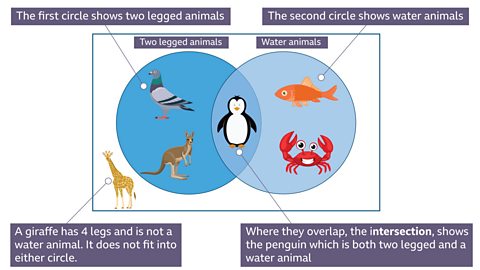
What is a venn diagram?
A venn diagram shows the relationship between groups of different things.
They are used in many areas of life to classify items as well as highlighting similarities and differences.
Some venn diagrams have 2 circles inside a rectangle and are very simple.

Solving problems with venn diagrams
Venn diagrams can be used to solve problems.
Example
Venn diagram showing the pizza toppings chosen by a group of friends.
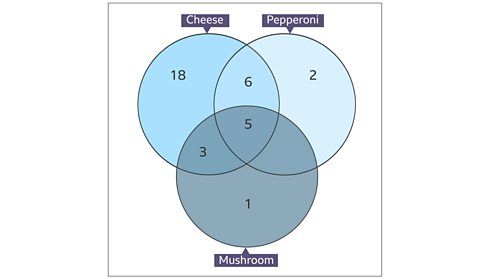
Use the venn diagram to answer the following questions:-
How many chose cheese?
How many chose pepperoni and cheese?
How many chose cheese but not mushroom?

\(18 + 6 + 5 + 3 = 32\)
32 chose cheese.

\(6 + 5 = 11\)
11 chose pepperoni and cheese.

\(18 + 6 = 24\)
24 chose cheese but not mushroom.
Question
Venn diagram showing the subjects studied by pupils in a year group.
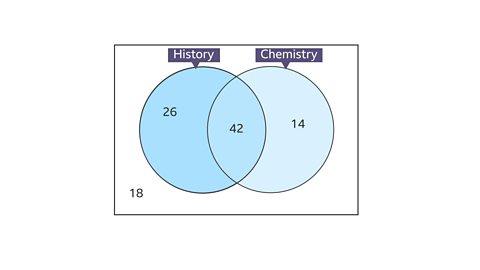
a. How many pupils study Chemistry?
b. How many pupils study History but not Chemistry?
c. How many pupils are in the year group?
Answer
a. \(42 + 14 = 56\) pupils study Chemistry.
b. 26 pupils study History but not Chemistry.
c. \(26 + 42 + 14 + 18 = 100\) pupils are in the year group.
Example
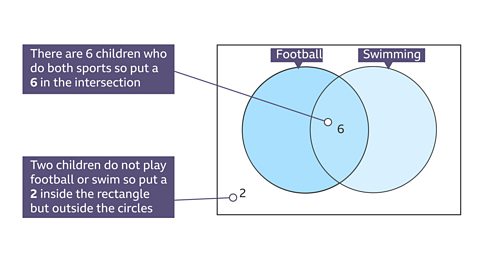
A class of children were asked if they play football or swim.
\(18\) said they play football, \(13\) swim and \(6\) play football and swim.
Two children do not play football or swim.
How many children are in the class?
How many children do not play football?
Drawing a Venn diagram makes answering this type of question easier.
Start by drawing a rectangle containing two intersecting circles as there are two sports.
Label one football and the other swimming.
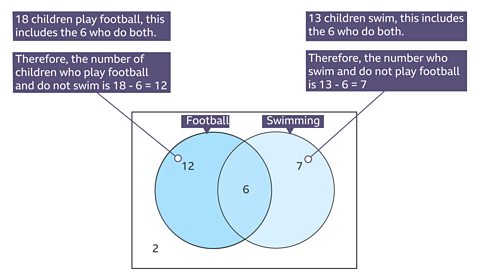
Venn Diagram to show pupils who play football and/or swim
Now use the venn diagram to answer the questions.
To find the total number of children add all the numbers inside the rectangle together.
- The total number of children in the class is \(12 + 6 + 7 + 2 = 27\)
To find the number of children who do not play football cover up the circle with football and add the other numbers.
- The number of children who do not play football is \(2 + 7 = 9\)
Question
In a survey \(200\) customers were asked their views on being an ethical consumer.
\(89\) customers said they like to buy Fairtrade products when they can.
\(131\) customers preferred to buy locally products.
\(45\) customers were keen to buy products from both the Fairtrade and the local range.
The remaining customers had not considered either Fairtrade or locally produced products.
How many customers had not considered either?
Draw a venn diagram to help answer this question.

Fairtrade and Local Produce is \(44 + 45 + 86 = 175\)
\(200 – 175 = 25\)
25 customers had not considered either.
Test section
The Venn diagram shows the genre of movies categorised by a drama class.
Question 1
How many of the movies were animation?
a) \(26\)
b) \(17\)
c) \(24\)
Answer
c) \(24\)
Question 2
How many adventure movies were not animated?
a) \(17\)
b) \(26\)
c) \(34\)
Answer
b) \(26\)
Question 3
How many movies were categorised by the class?
a) \(60\)
b) \(70\)
c) \(50\)
Answer
a) \(60\)
Question 4
JosГ© has made \(100\) tacos for his fast food stall.
\(65\) tacos have tomatoes.
\(47\) tacos have peppers and tomatoes.
\(12\) tacos have neither peppers nor tomatoes.
Which one of the following venn diagrams shows the above information correctly?
a)
b)
c)
The correct answer is a).
Question 5
How many tacos have peppers?
a) \(23\)
b) \(70\)
c) \(47\)
Answer
c) \(70\)
More on Representing and interpreting data
Find out more by working through a topic
- count1 of 3
- count2 of 3